Individual Livestream Analysis
This article details how to get the analysis results of an individual livestream.
Before we start
- We suggest first reading the Analysis Module Introduction to learn the key features and how to access the Analysis module on the BlendVision One web console.
- You can also refer to Overall Analysis for overall trends and usage with visualized graphics.
Livestream analysis list
This page allows you to get an overview of the metrics for each of your livestreams, providing you with detailed insights into your content.
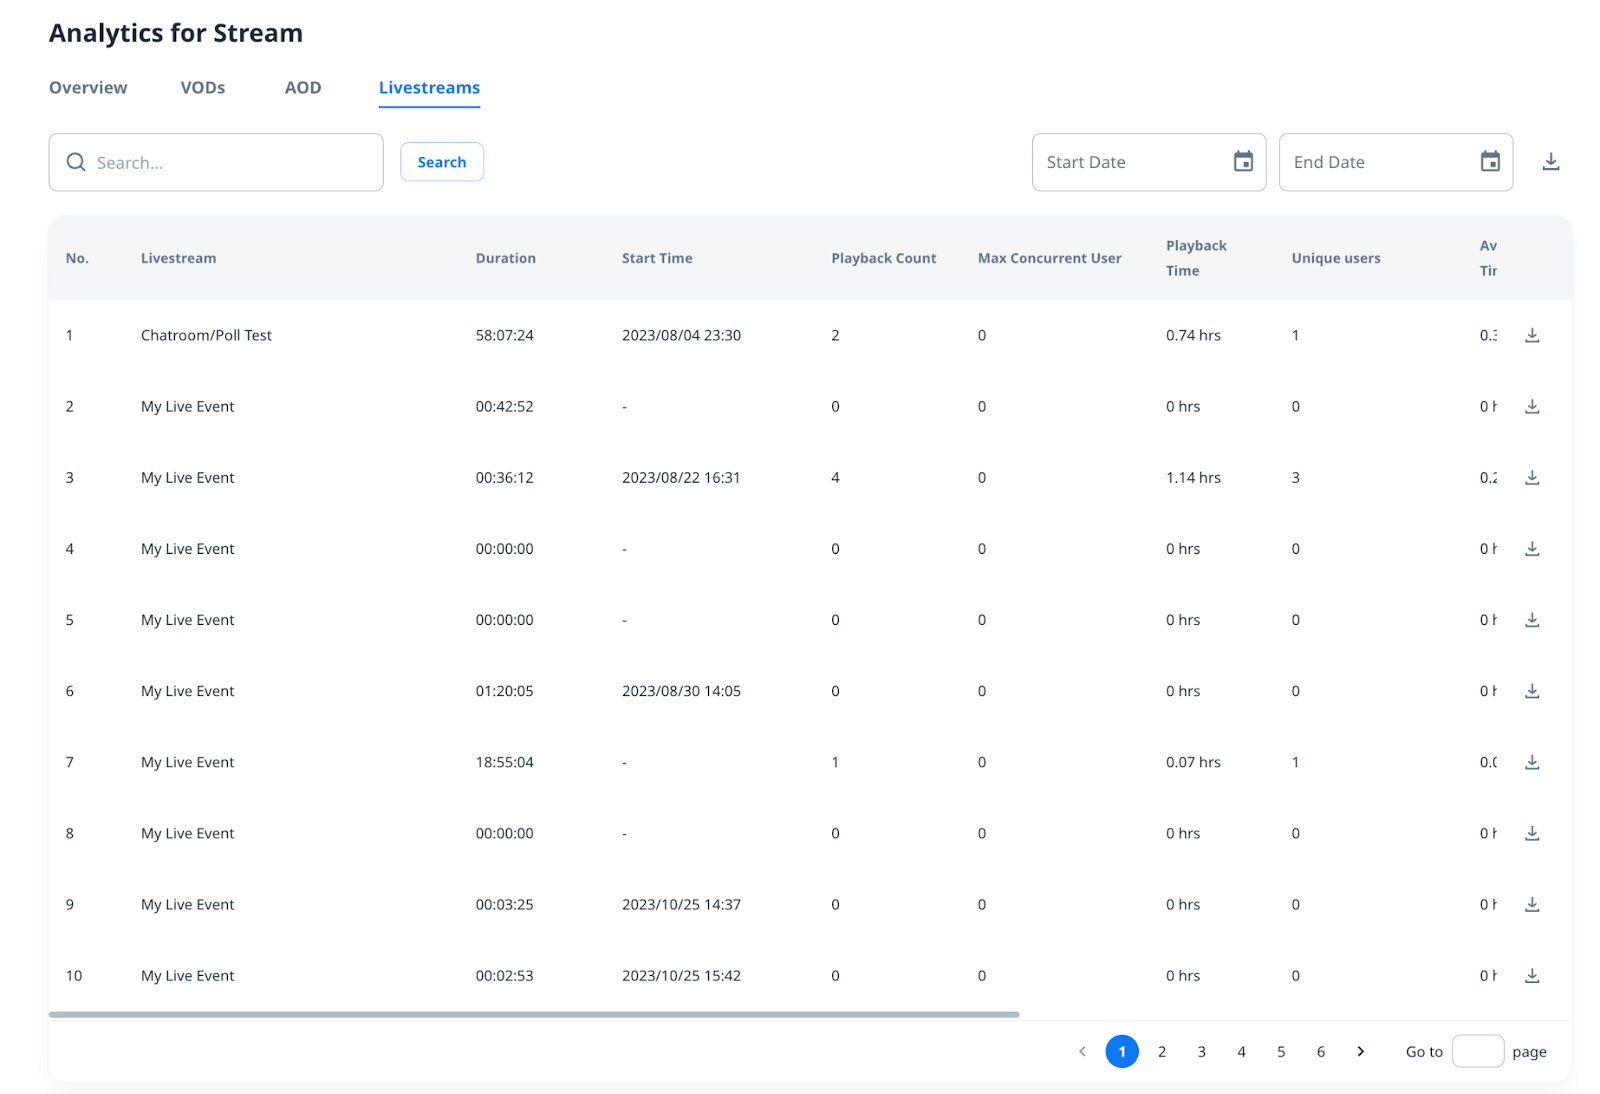
Search
You can search for content titles by entering keywords into the search field: (Japanese/English/Chinese)
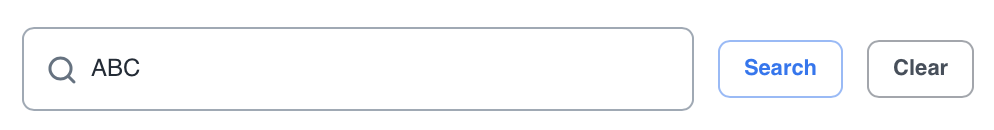
- Press the “Search” button to show the search results in the table.
- Press the “Clear” button to reset the search.
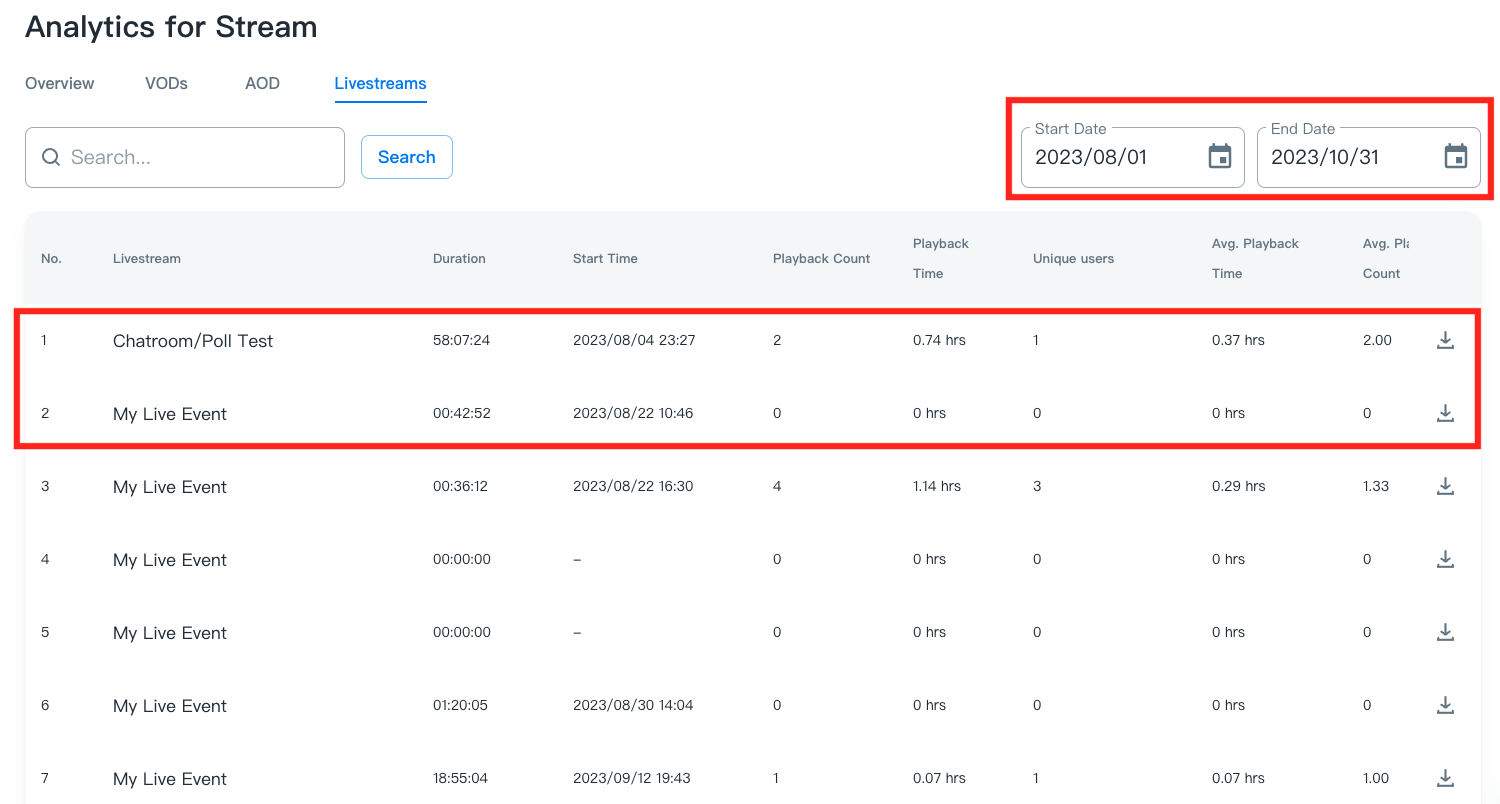
Time Filtering
If you want to realize the playback information within a specified period of time, you can confirm it via time filtering function.
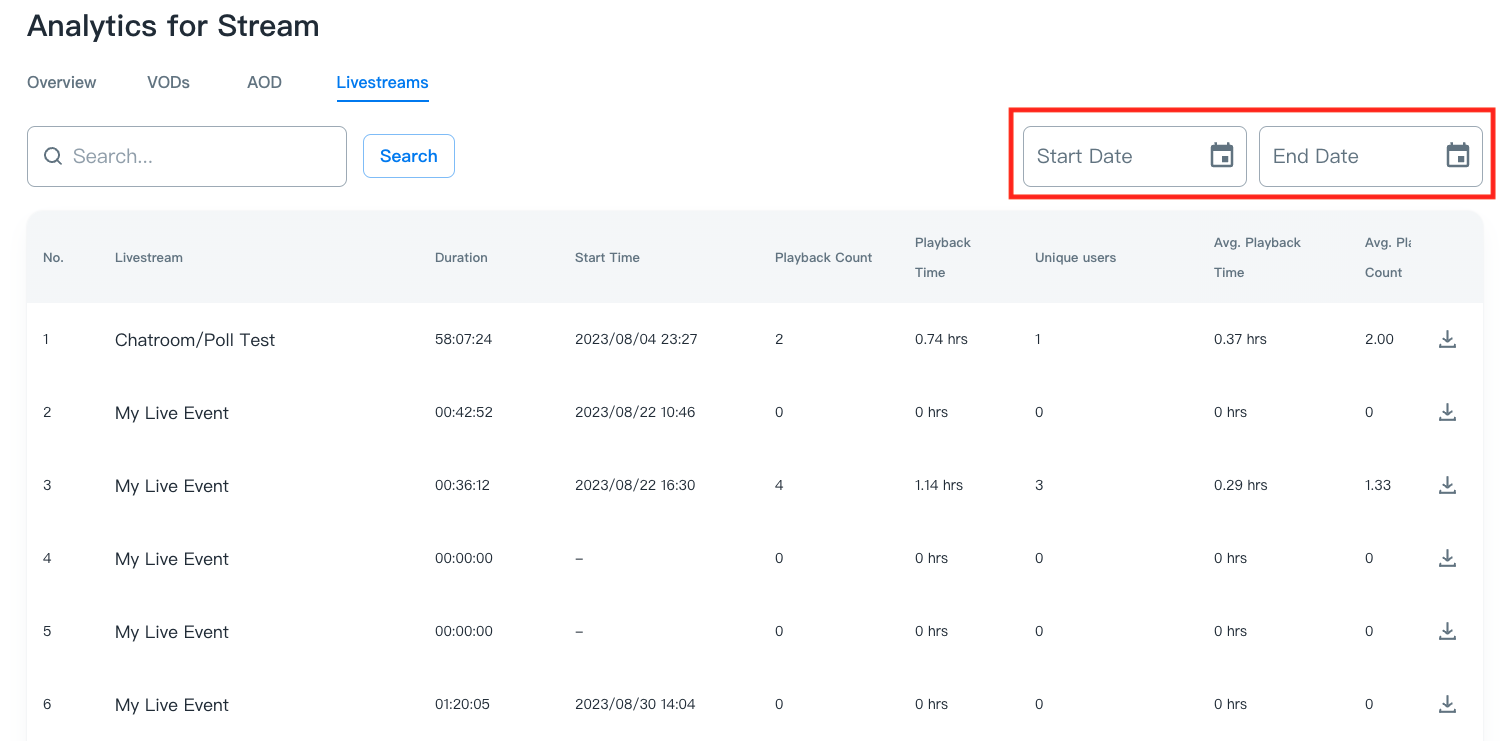
By entering the specified time period into the “Start Date” and “End Date” fields, the playback information will be displayed on the table.
Note:
- For data integrity, please exclude the dates within the last 2 days.
- If the content has not been played within the specified period of time, Playback Count value will display 0.
- The playback information of deleted contents will also be displayed on the table.
Content summary
By clicking on a specific livestream in the table, a pop-up window with information and metrics will be displayed.
- Live tab: shows the details of the livestream.
- Live-To-VOD tab: shows the details of Live-to-VOD.
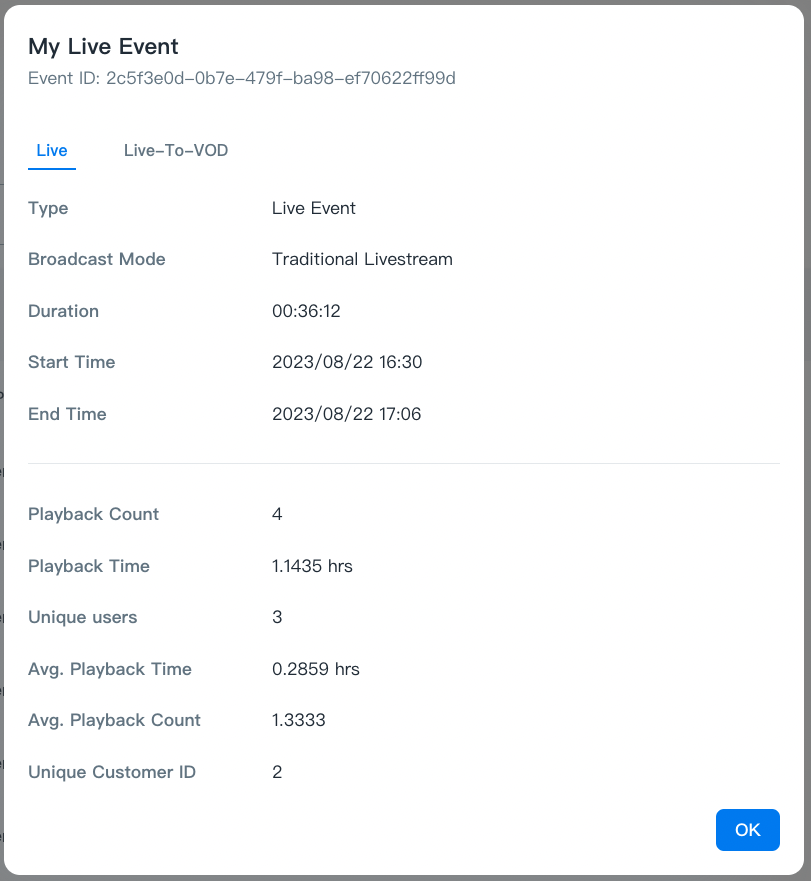
Information and metric definitions for livestreams.
Information
Definition
Event ID
The unique ID of the livestream.
Type
The type of the livestream.
Broadcast Mode
The broadcast mode of the livestream.
Duration
The total duration of the livestream between the start and end time (inclusive) and the preview.
Start Time
The time when the event went live.
End Time
The time when the event ended.
Metrics
Definition
Playback Count
Total livestream views, including during the preview.
Max
Concurrent User
The max concurrent user count of the live event.
Playback Time
Total livestream watch time, including during the preview.
Unique users
The number of unique individuals who watched the livestream (estimated through unique device IDs)
Playback Time
Estimated average hours watched per view (total watch time / total number of views).
Avg. Playback Count
Estimated average number of views per viewer (total number of views / number of viewers).
Unique Customer ID
The unique ID of your customer.
Information and metric definitions for Live-to-VOD
For the events not enabled Live-to-VOD, the values will show as “-” or “0”.
Information
Definition
Event ID
The unique ID of the livestream.
Start Time
The scheduled start time of the Live-to-VOD.
End Time
The scheduled end time of the Live-to-VOD.
Metrics
Definition
Playback Count
The accumulated views of the Live-to-VOD.
Playback Time
The accumulated watch time of the Live-to-VOD.
Unique users
The number of unique individuals who watched the content (estimated through unique device IDs)
Playback Time
Estimated average hours watched per view (total watch time / total number of views).
Avg. Playback Count
Estimated average number of views per viewer (total number of views / number of viewers).
Unique Customer ID
The unique ID of your customer.
Download report
Detailed watch time report and metrics are available in .csv format.
Please refer to Download Analytic Reports.