Dashboard Introduction for Reseller
In this article, we'll introduce the key features of Dashboard module in Reseller organization:
Access Dashboard module for Reseller
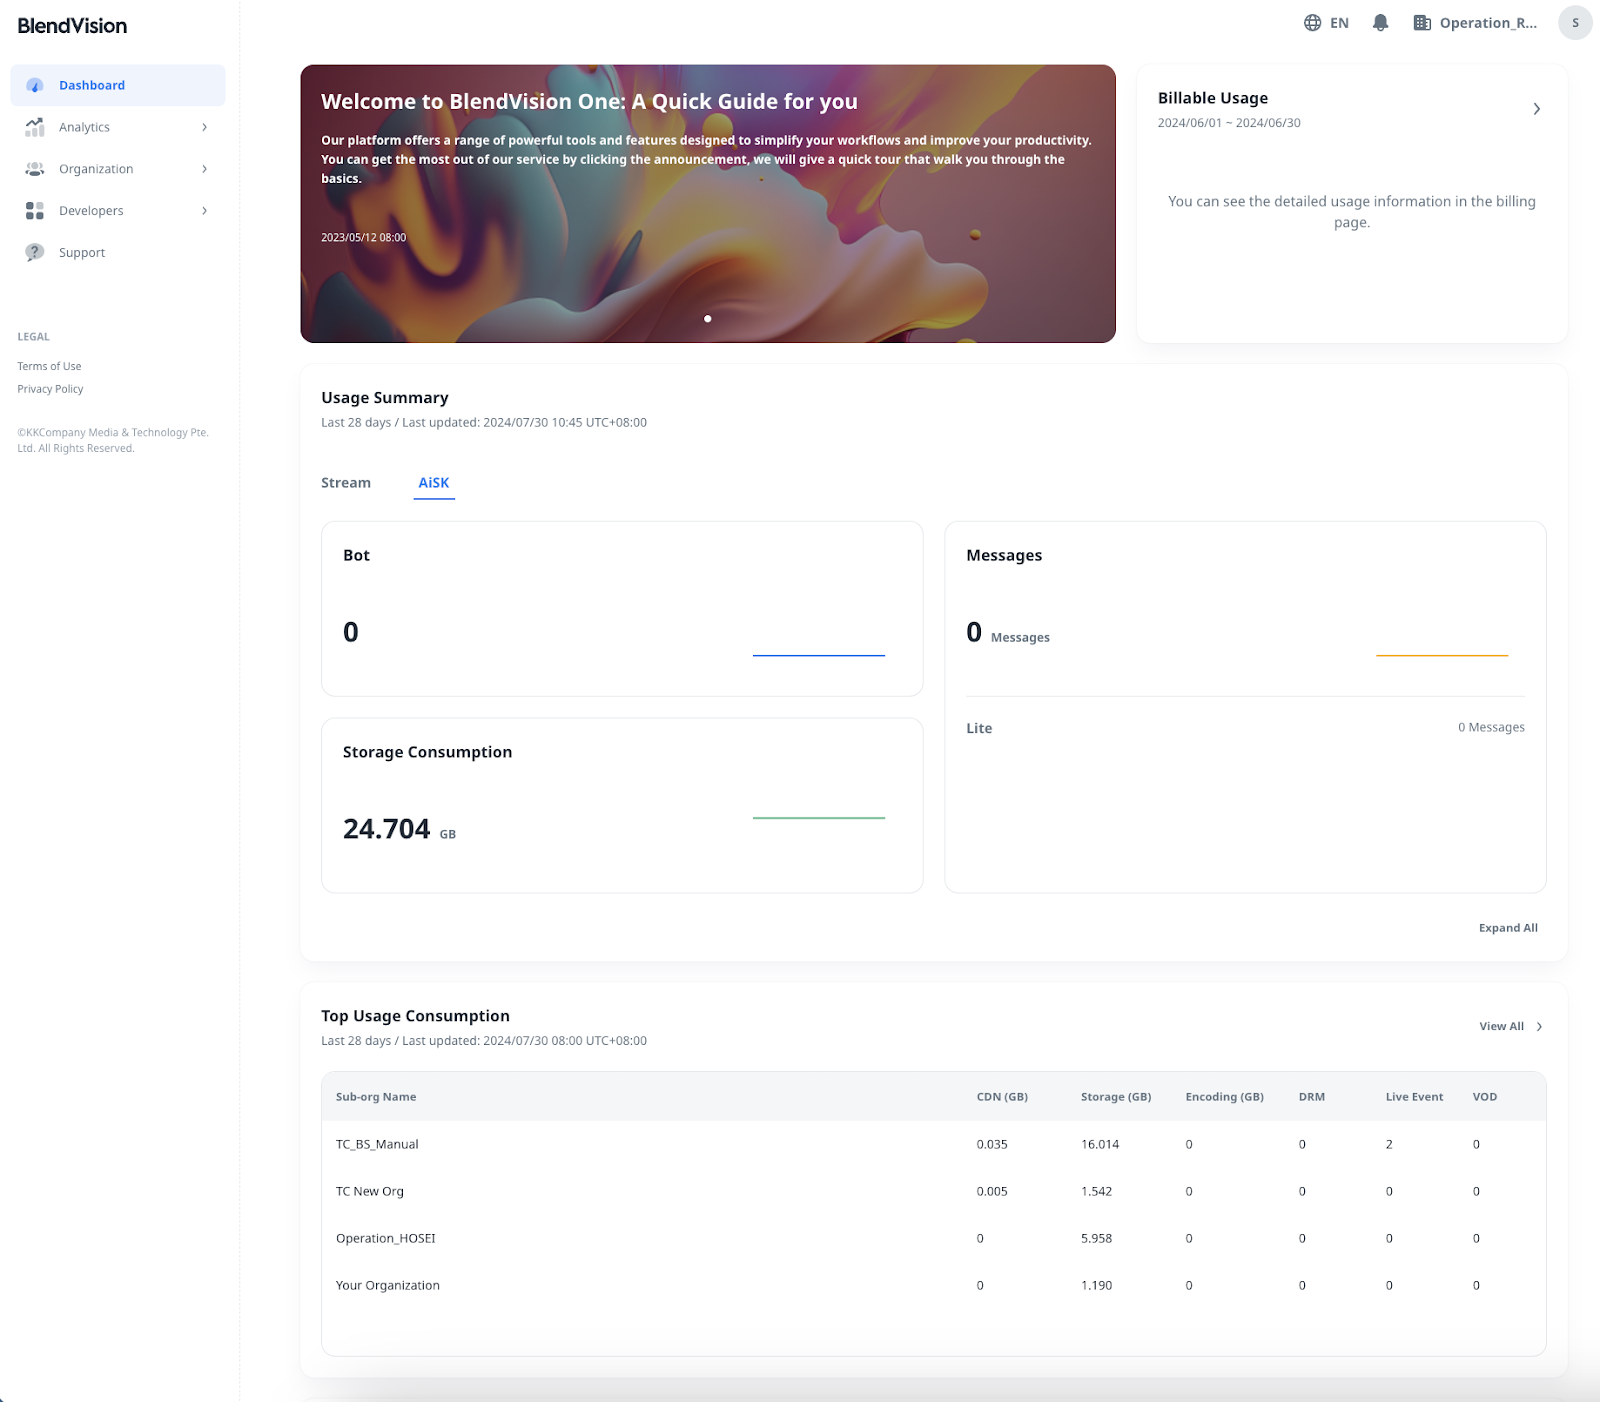
Dashboard is the top page when you login in BlendVision Web Console.
You can also click “Dashboard” item on the left sidebar.
Key Feature
Banner & Billable Usage
On the top of dashboard, there are Banner and Billable Usage:
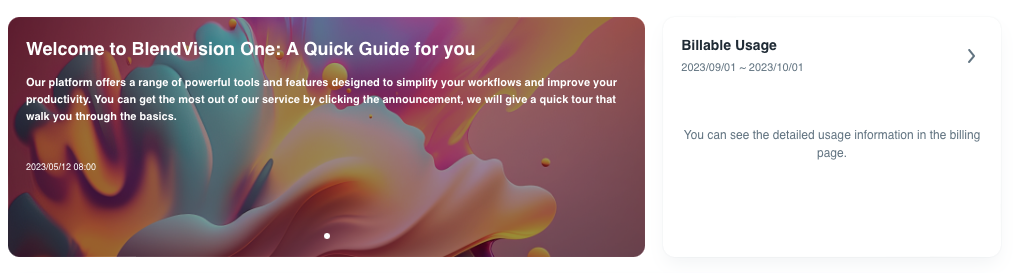
- Banner: it shows the latest news of BlendVision, such as release notes and maintenance information.
- Billable Usage: Click it to redirect to the Billing page of Organization module
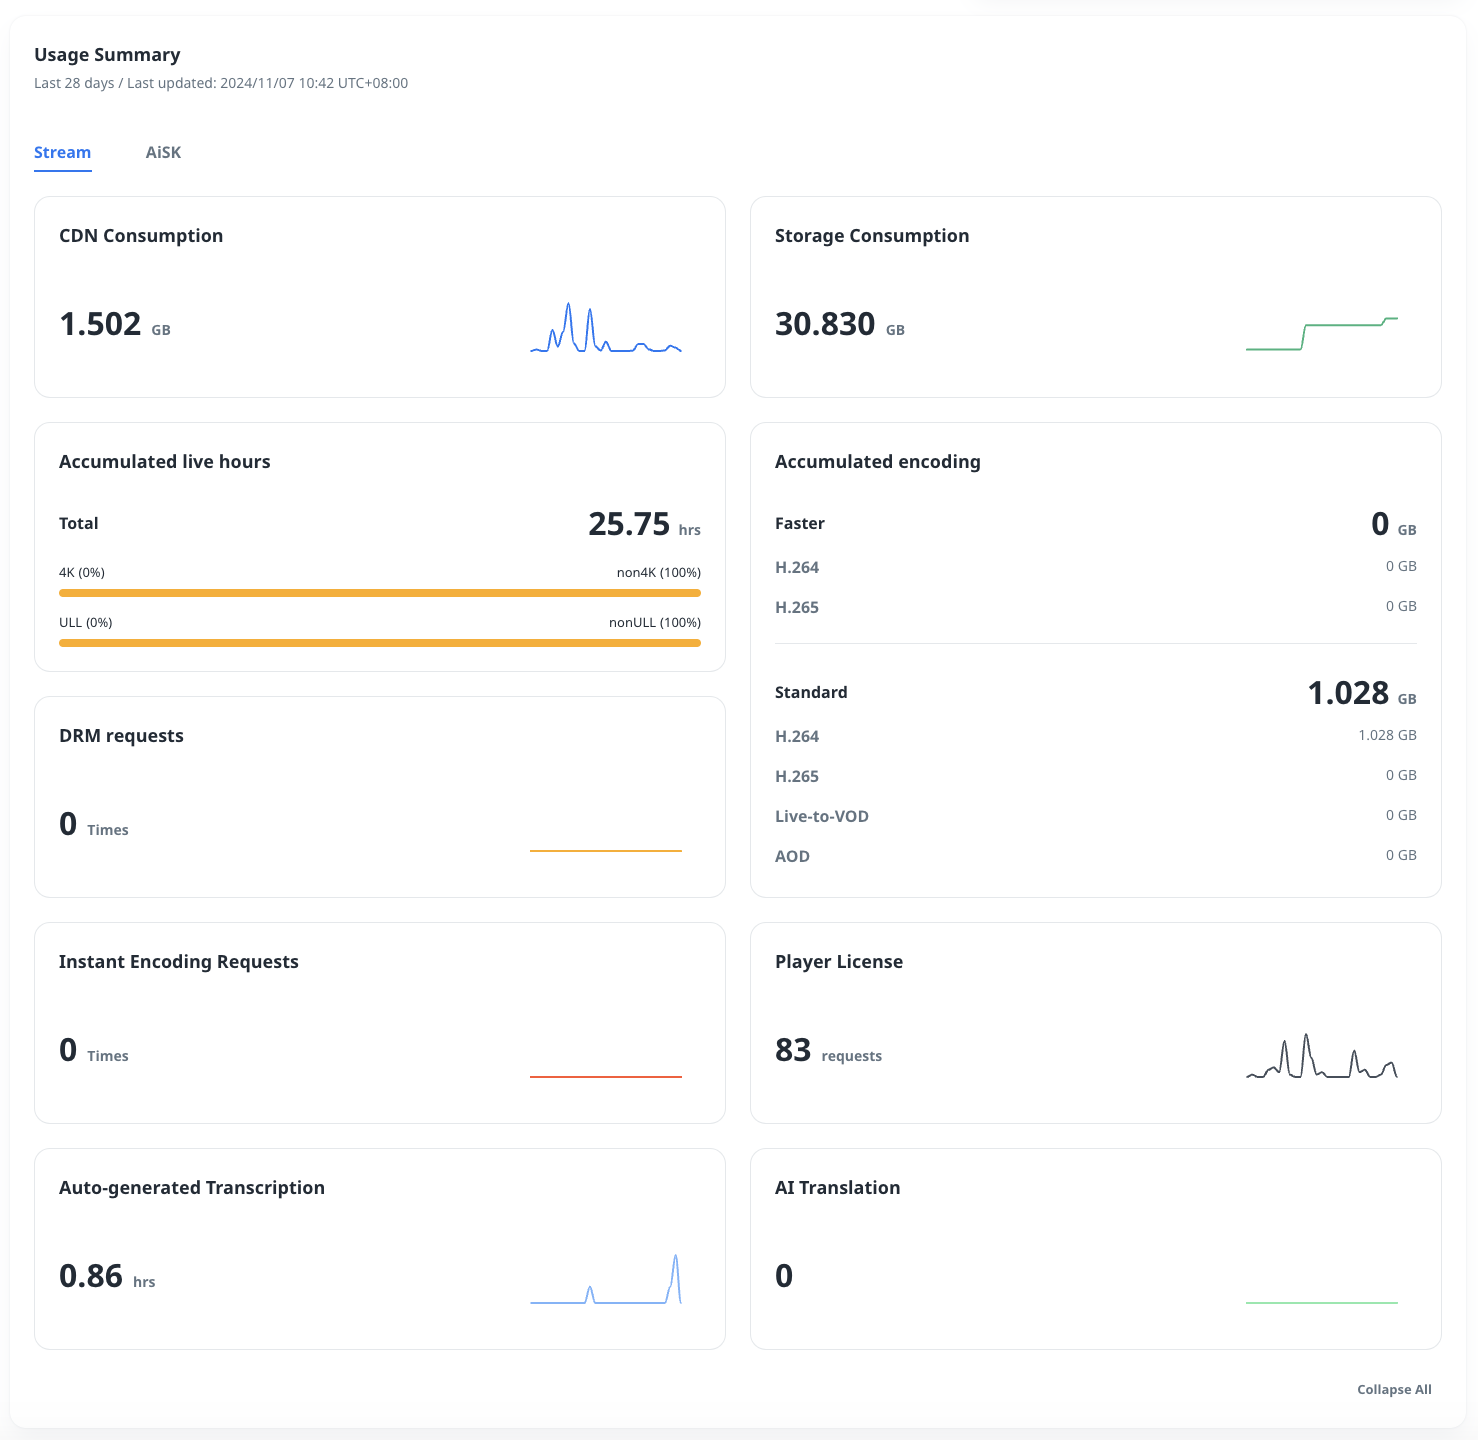
Usage Summary
The visualized graphics show the total usage of Stream/AiSK for all sub-organizations in the last 28 days.
You can click the “Expand All” or “Collapse All” to show/hide the information.
Stream
-
- CDN Consumption: The CDN usage in GB.
- Storage Consumption: The Storage usage in GB.
- Accumulated live hours: The total live hours, the percentage of 4K live/non-4K live, and the percentage of ULL live/non-ULL live.
- DRM requests: The DRM requests in times.
- Accumulated encoding: The encoding usage in GB for Faster queue and Standard Queue (include sub-options)
- Instant Encoding Requests: The encoding requests in times.
- Player License: The player license key requests in times.
- Auto-generated Transcription: The consumption with the length of the Source files multiplied by the number of audio tracks.
AI Translation: It shows the subtitle characters of AI translation by amount.
AiSK
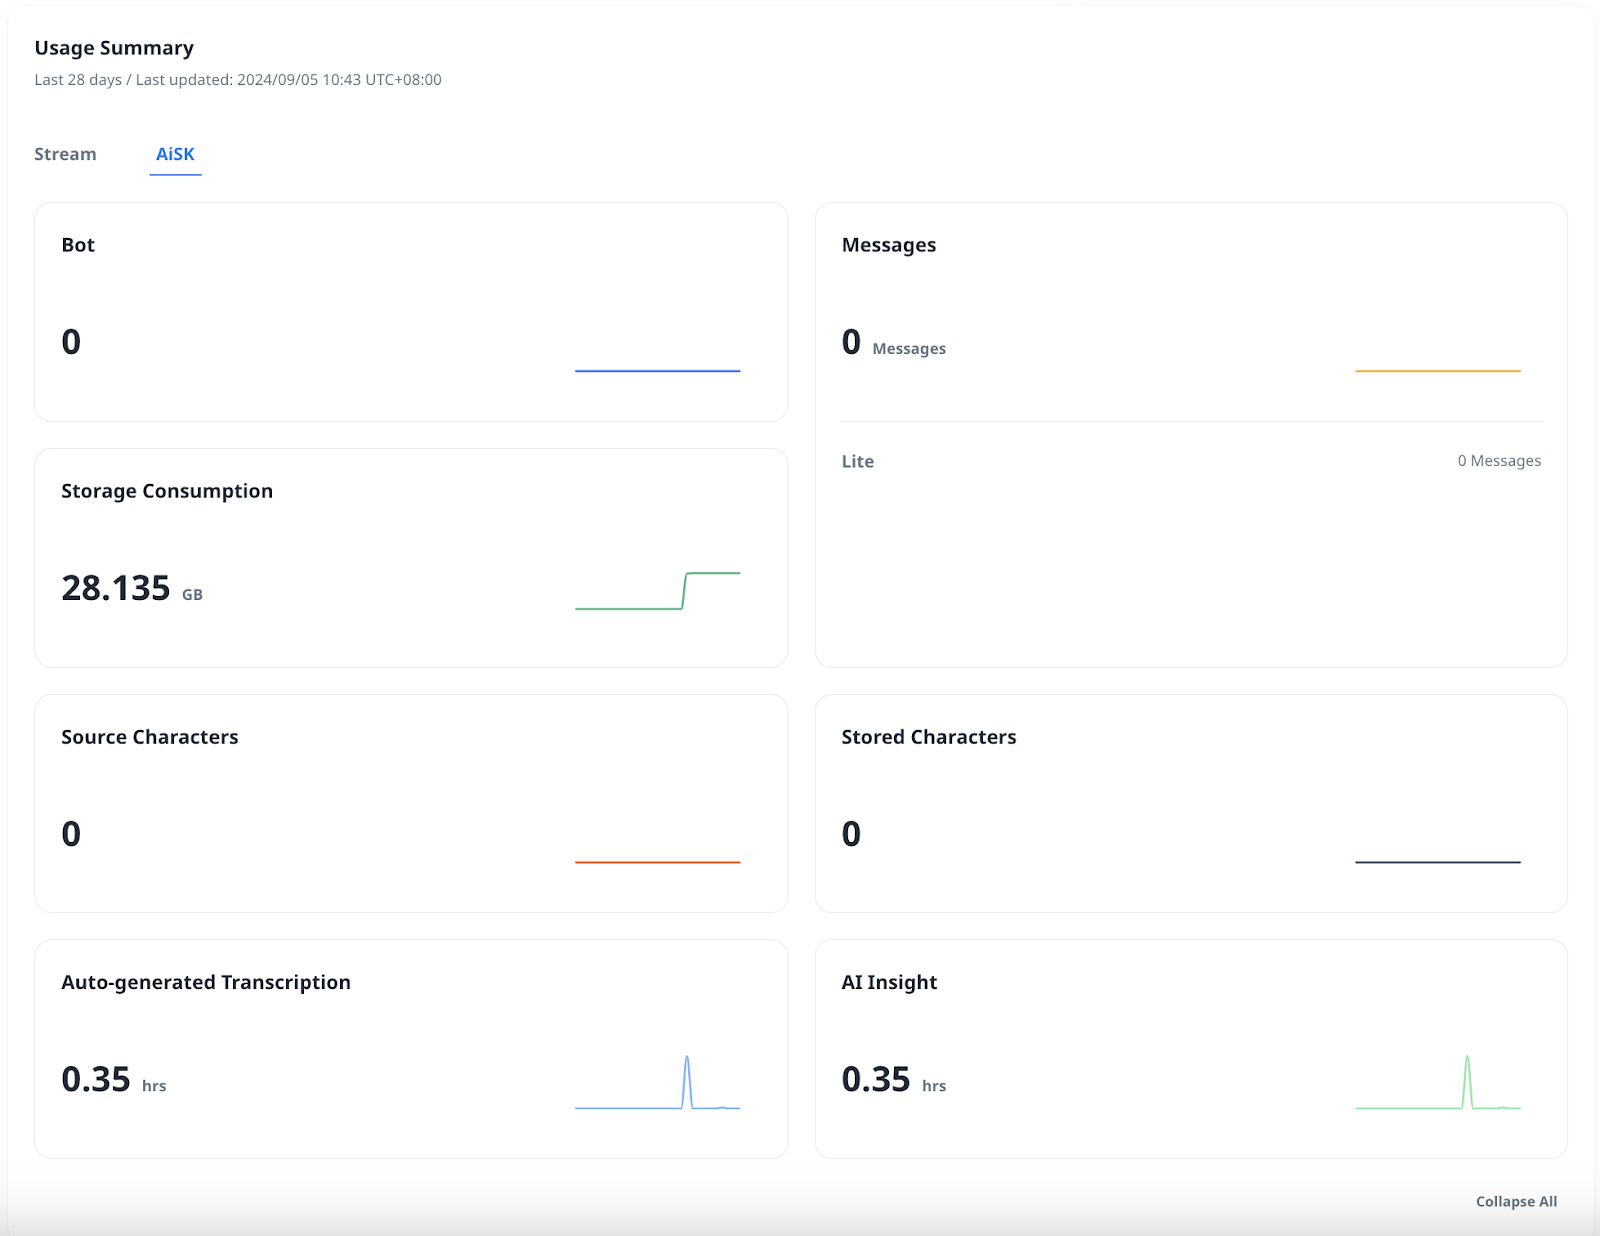
- Bot: The amount of Ready unique bot (Bot ID) counting consumption.
- Messages: The count of messages (User query).
- Storage Consumption: The storage usage in GB.
- Source Characters: The count of Source characters.
- Stored Characters: The count of Stored characters.
- Auto-generated Transcription: The consumption with the length of the Source files multiplied by the number of audio tracks.
Top Usage Consumption
The table shows the total usage of each sub-organization in the last 28 days.
You can click the “View All” to confirm the detailed information via Analytics module.
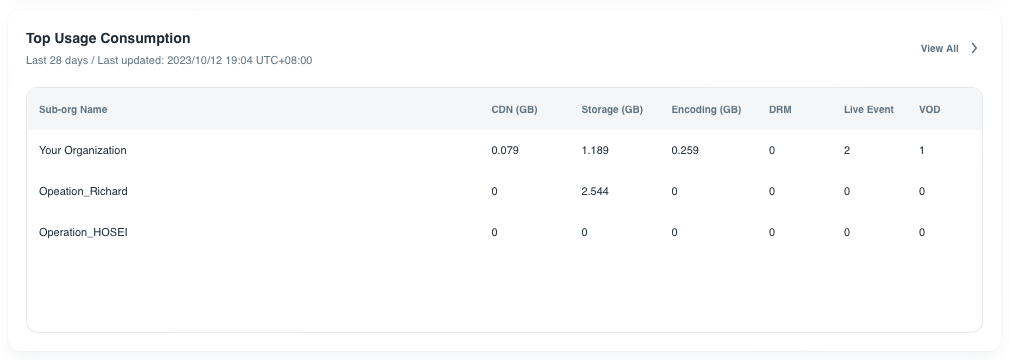
- CDN (GB): it shows CDN usage in GB.
- Storage (GB): it shows Storage usage in GB.
- Encoding (GB): it shows total encoding usage in GB
- DRM: it shows DRM requests in times.
- Live event: it shows the number of live events.
- VOD: it shows the number of VODs.
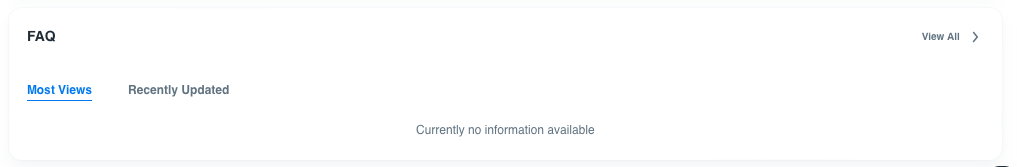
FAQ
It shows the help center articles for reference.